


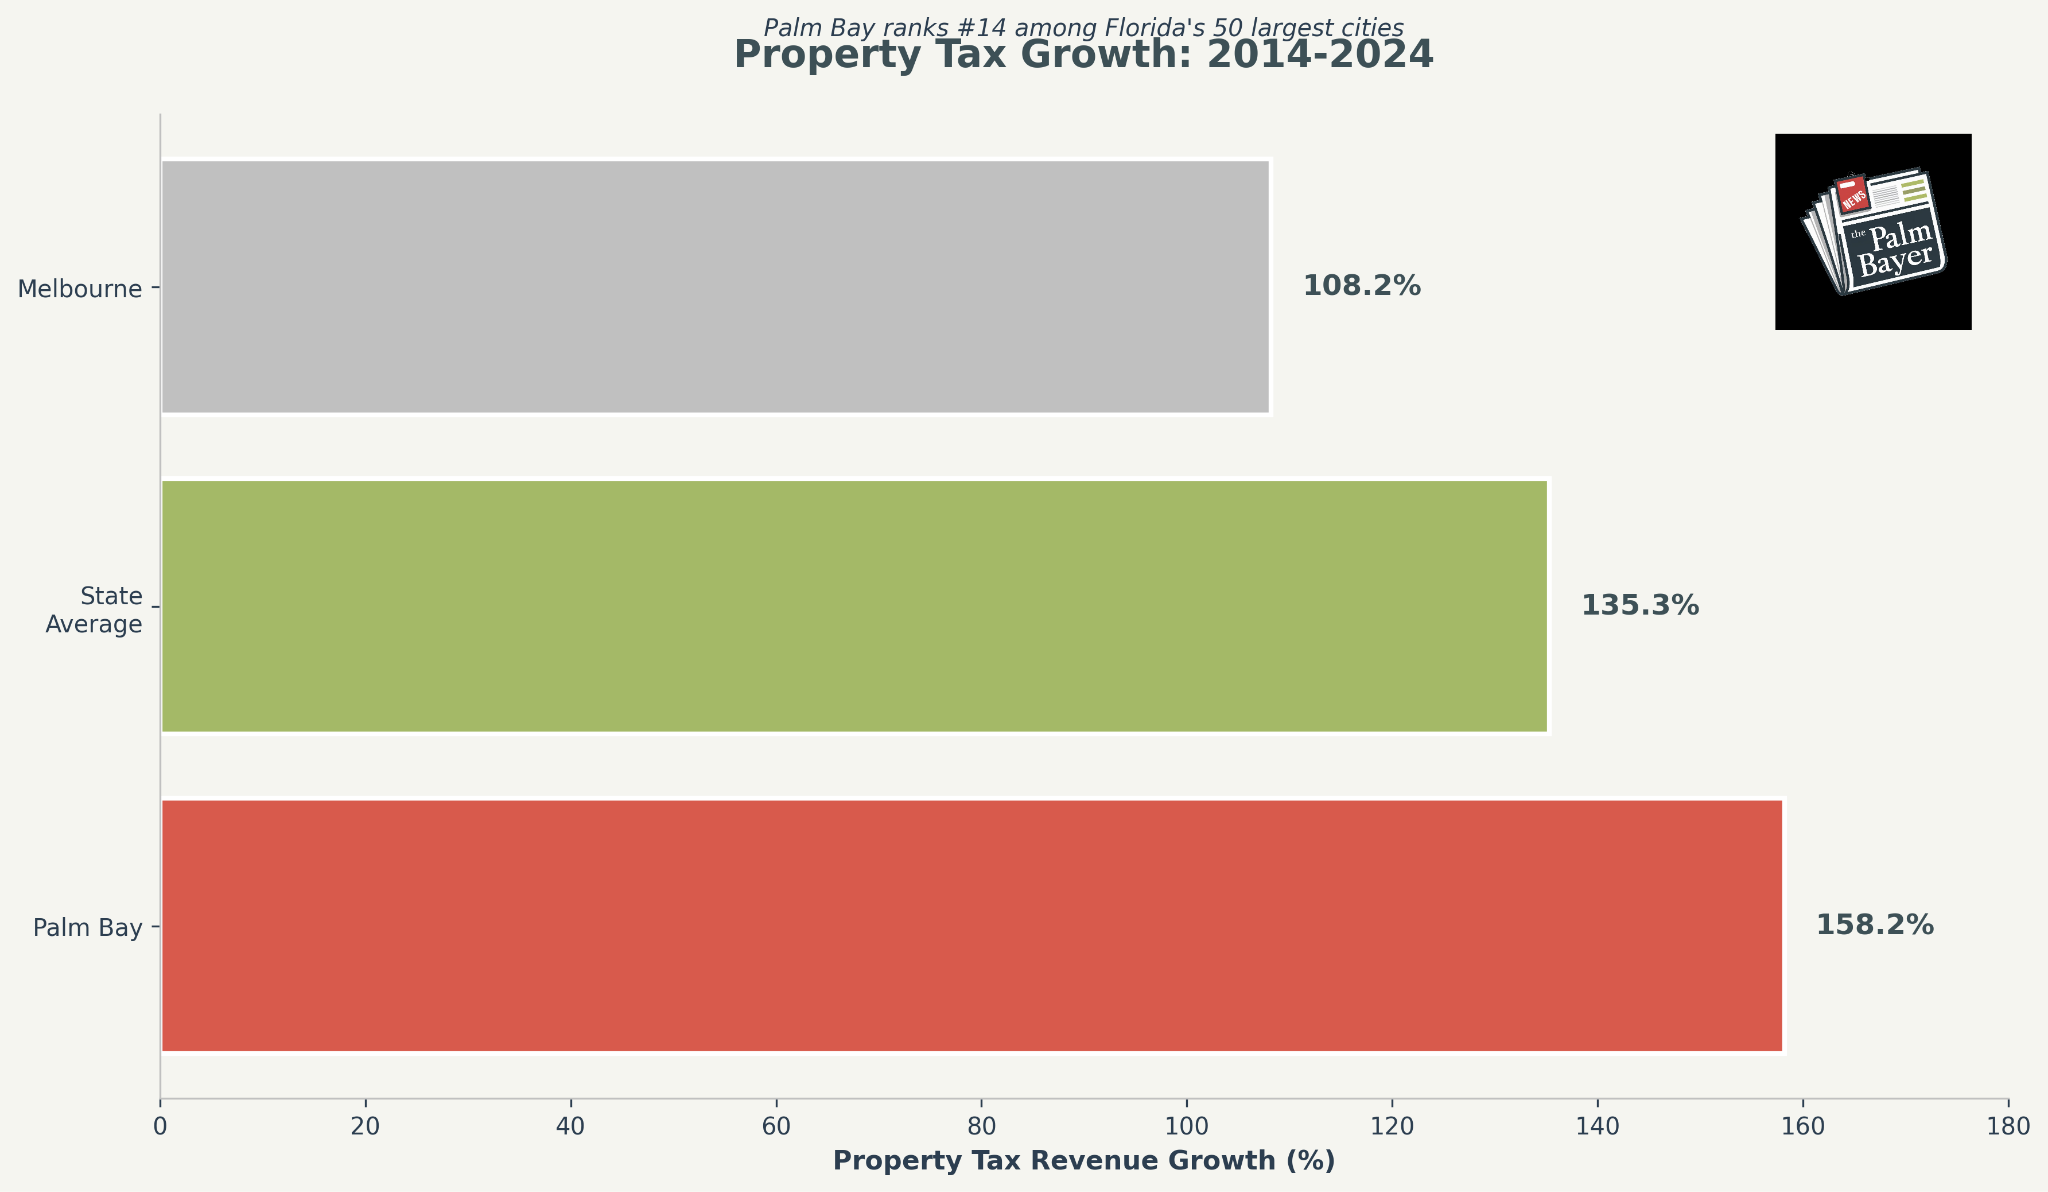
Palm Bay, FL — A December 2025 report from Florida TaxWatch ranks Palm Bay’s property tax growth at #14 among the state’s 50 largest cities over the last decade, with a 158.2% increase from 2014 to 2024. That figure outpaces the statewide city average of 135.3% and cities like Melbourne (108.2%, #40). It also raises an obvious question: if Palm Bay is growing taxes that fast, why does the city keep saying it cannot fund basic services?
The answer is buried in the same report, in a set of county-level tables that tell a very different story about where the tax burden actually falls, and in a budget mechanism that has now produced a mathematical result its own designers likely never anticipated.
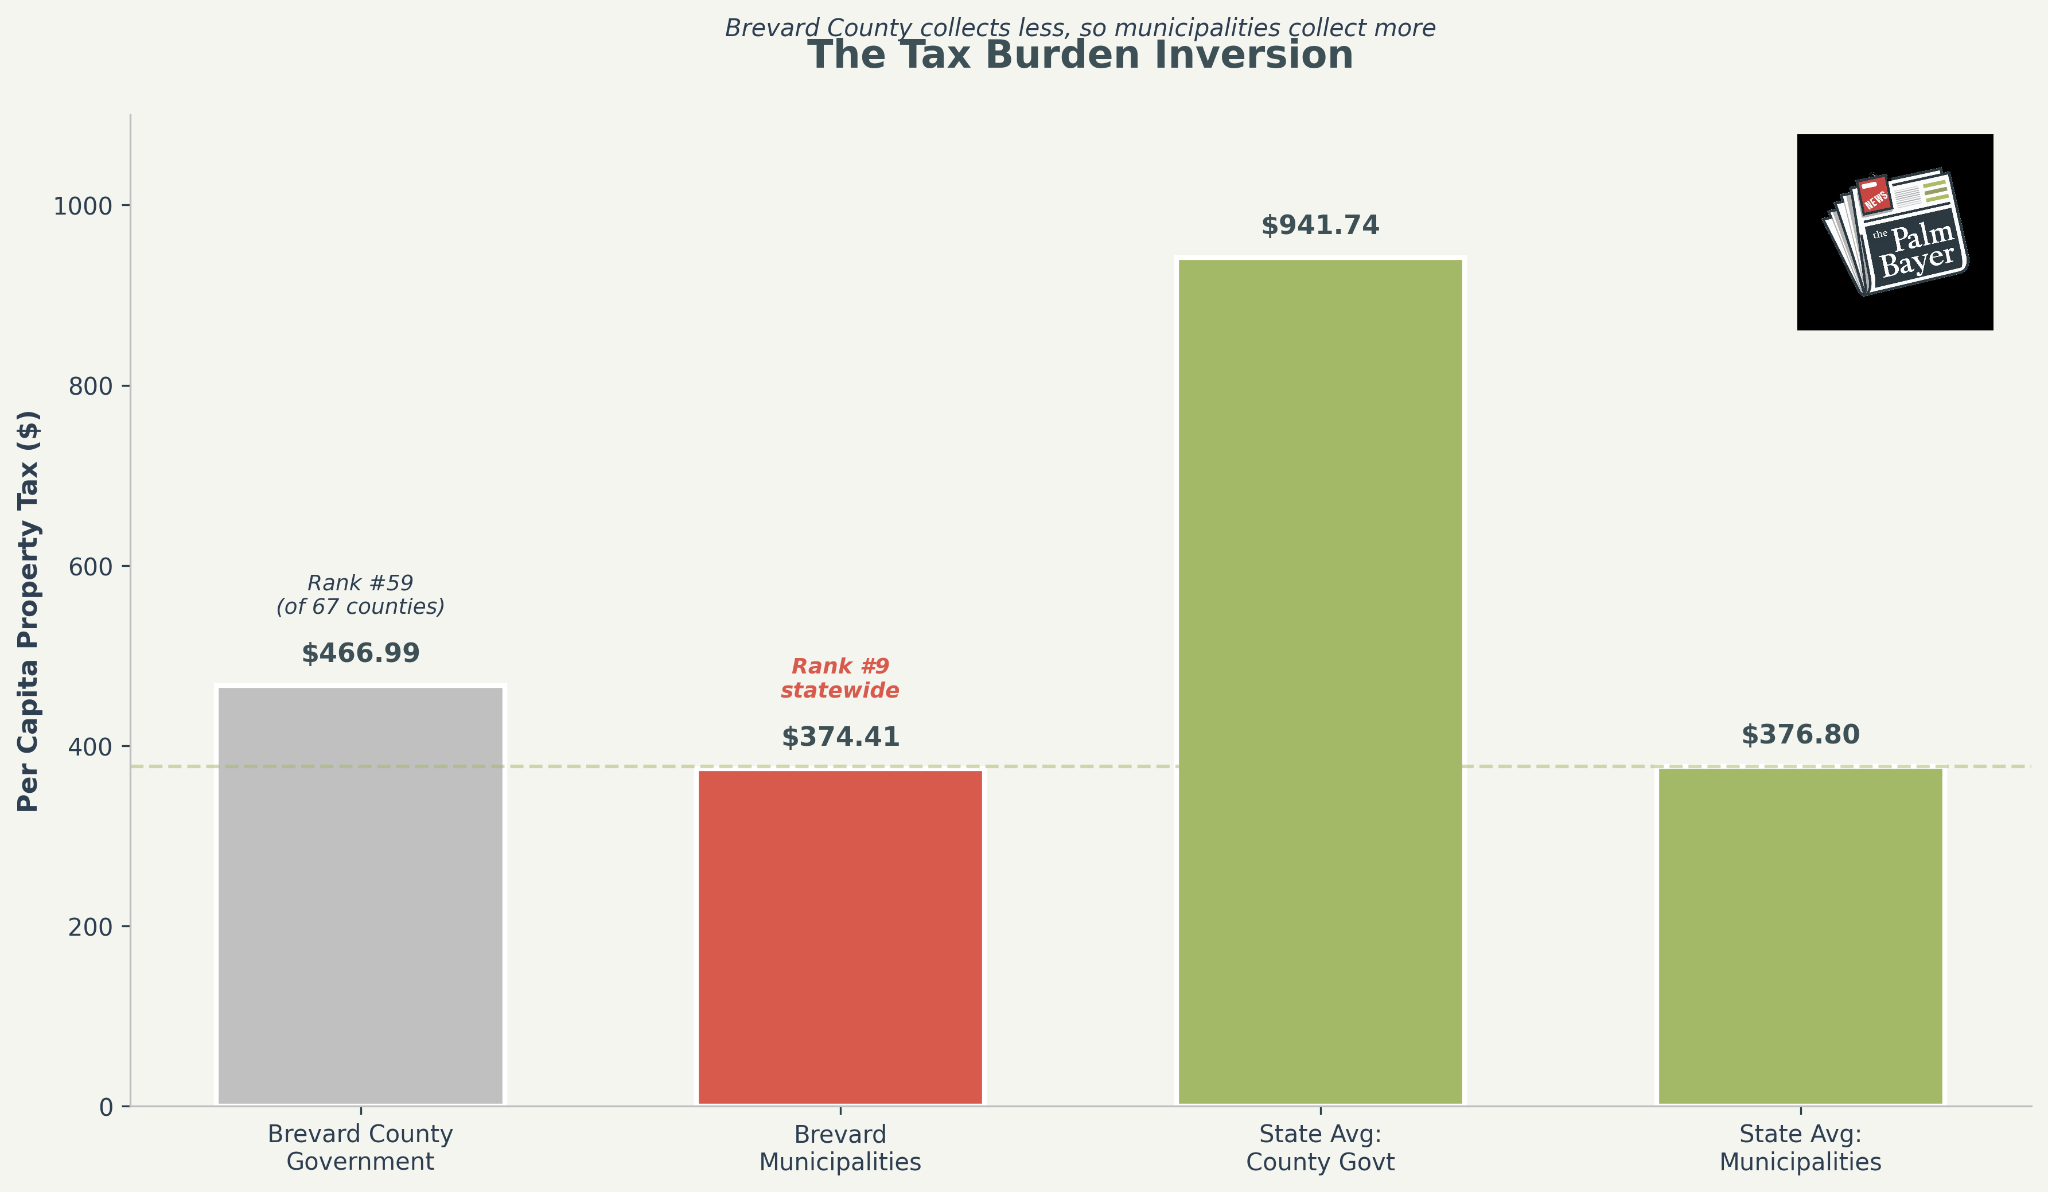
The County Shifts the Load
Brevard County’s government collects $466.99 per capita in property taxes, ranking #59 out of Florida’s 67 counties. That is roughly half the statewide county average of $941.74 and places Brevard among the lowest-collecting county governments in the state. The figure matters because county-level taxation sets the baseline for every municipality within its borders.
Where Brevard collects less, its cities collect more. Brevard’s municipal property tax levy sits at $374.41 per capita, ranked #9 statewide, right at the state average of $376.80. This inversion means Palm Bay and other Brevard municipalities carry a share of the tax burden that in most Florida counties falls on the county government. For residents reading their annual tax bill, the city line item appears high not because Palm Bay is overtaxing relative to peers, but because the county line item is unusually low.
The combined result: Brevard’s total per capita property tax of $1,608.78 ranks #33 statewide, well below the state average of $2,397.57. Palm Bay residents pay more than they used to, but less than most Floridians in comparable metro areas.
The Bedroom Community Tax Base
Palm Bay was built as a bedroom community. The General Development Corporation platted tens of thousands of residential lots starting in the 1960s, creating a city that is overwhelmingly residential by design. That legacy translates directly into tax policy: without a broad commercial or industrial base to share the ad valorem burden, homeowners absorb the full weight of city operations.
The city has pursued economic development to broaden the base. Companies like L3Harris and Rogue Valley Microdevices have received ad valorem tax abatements to locate or expand in Palm Bay. Those abatements bring jobs and long-term economic activity, but in the short term, they reduce the very property tax revenue the city needs to fund services for the growing population those jobs attract.
Impact fees, which new development pays upon permitting, are legally restricted to capital capacity: new roads, new fire stations, new infrastructure. They cannot fund salaries, maintenance, or operating costs. As the city adds roughly 430 residents per month, those operating costs climb while the revenue tool designed to capture growth-related costs cannot touch them. Brevard’s per capita impact fees rank #13 statewide at $165.64, above the state average of $112.45, indicating the county and its cities are already leveraging this tool aggressively. The structural gap remains.
158% Growth From a Low Base
Context changes what the 158.2% figure means. Palm Bay’s operating millage rate in 2014 was 8.4500 mills. By FY2025, it had fallen to 6.7339 mills, a decline of more than 20%. The city did not raise rates to produce that 158% revenue growth. Rising property values, new construction, and population expansion generated the increase even as the rate dropped year after year.

Budget documents confirm this trajectory. Ad valorem revenue grew from $35.7 million in FY2021 to an estimated $66.9 million in FY2026, with year-over-year increases ranging from roughly 6% to 22%. Every dollar of that growth came from an expanding tax base, not from rate increases. The millage rate declined in five of the last six fiscal years.
The TaxWatch report also ranks Palm Bay’s municipal expenditure growth at #10 among Florida’s 70 largest cities, at 88.5% from FY2012-13 to FY2022-23. The combined population-and-inflation benchmark for the same period was 67.7%, meaning spending outpaced the baseline by about 21 percentage points. That gap is significant but must be read alongside what the spending funded: a police department that ranks 241st out of 246 in Florida for staffing at 1.36 officers per 1,000 residents (state average: 2.31), pension obligations that spiked $11 million (30.6%) in the FY2026 preliminary budget, and debt service on a $150 million General Obligation Bond voters approved in 2018 to pave roads.

The 3% Cap Paradox
The most consequential number in the report is one that does not appear in the TaxWatch tables at all. It lives in Section 6.01(b) of the Palm Bay City Charter: a voter-approved cap limiting annual increases in budgeted ad valorem revenue to 3% over the prior year, excluding new construction.
Voters enacted the cap in 2016 with 71% support. When the City Council placed a repeal question on the 2022 ballot, voters rejected it with 65% opposition. The mechanism has clear democratic legitimacy. It also has a structural consequence that Assistant Finance Director Angelica Collins laid out during the May 2025 budget workshop: if current trends continue, Palm Bay could fall below the rollback rate by FY2027, meaning the city would collect less property tax revenue year-over-year even with the cap in place.
That projection arrived early. For FY2026, the calculated 3% cap rate dropped to 6.3658 mills, which fell below the rollback rate of 6.4071 mills for the first time in the cap’s history. The inversion was triggered by the May 2024 sunset of the Bayfront Community Redevelopment Agency (BCRA). The CRA’s Tax Increment Financing revenue, approximately $2.0 to $2.6 million annually, had been segregated from the general revenue calculation. When those funds were reabsorbed into the city’s tax base, Florida Department of Revenue adjustments pushed the 3% cap calculation below the rollback threshold.
, Rollback Rate (black line), and Adopted Rate (dashed olive green line) with a crossover zone marked. Includes annotations for First Crossover FY2025, Cap Recalculated critical need, and Crossover Zone. Chart includes The Palm Bayer logo.")
Had the city adopted the 3% cap rate of 6.3658, it would have generated approximately $411,876 less than the rollback amount and required roughly $3.7 million in cuts. On September 8, 2025, City Council voted to declare a critical need and exceed the cap by supermajority, ultimately adopting a rate of 6.7000 mills. That adopted rate was higher than both the 3% cap and the rollback rate, but lower than the prior year’s rate of 6.7339. The critical needs cited: police and fire pension obligations, capital assets including fire trucks and police vehicles, and operating costs for new city facilities.
The Charter Review Commission Weighs In
On February 12, 2026, the Palm Bay Charter Review Commission took up Article 6 of the City Charter, which contains the 3% cap language. Two proposals were presented.
Vice Chair Thomas Gaume proposed removing the “emergent and critical need” declaration language and replacing the supermajority requirement with an explicit consensus of four council members. His rationale: the declaration requirement has never functionally constrained council, and the real safeguard is the vote threshold itself. That proposal failed to receive a second.
Commissioner Phil Weinberg proposed full repeal of the 3% cap, arguing the mechanism now forces the city below the rollback rate and citing the county’s parallel infrastructure funding challenges. That proposal failed 7-2, with only Weinberg and Commissioner Chandler voting in favor.
The commission’s recommendation signals strong opposition to modifying the cap, but the Charter Review Commission is an advisory body. The City Council retains final authority over which charter amendments are placed on the ballot and could still propose changes to the 3% cap language through a separate referendum process independent of the commission’s recommendations. As it stands, the structural dynamic the cap creates, where Council must annually declare a critical need to fund baseline operations, will continue unless Council acts on its own.
What the Numbers Mean for Residents
The TaxWatch report and the Charter Review outcome together frame a bind that is unlikely to resolve itself through growth alone. Property values continue to rise, new construction continues to add homes to the tax rolls, and revenue continues to climb in absolute dollars. But the rate at which the city can capture that revenue is now mechanically constrained below the rate needed to maintain prior-year service levels.
Palm Bay spends $769.72 per capita on public safety at the county level, ranked #46 statewide against an average of $1,045.05. Its residents earn $60,162 per capita, ranked #20, below the state average of $68,703. The city is simultaneously undertaxed relative to peers, under-resourced relative to need, and voter-constrained from closing the gap through its primary revenue tool.
The question facing Palm Bay is not whether the 158.2% tax growth figure is alarming. In context, it represents a city catching up from a structurally low base while its population outpaces its capacity. The question is what happens when the catching-up stalls, and whether the annual critical-need declaration becomes a permanent workaround for a cap that now produces results its authors never intended.
Disclosure: Thomas Gaume, publisher of The Palm Bayer, serves as Vice Chair of the Palm Bay Charter Review Commission. His proposals related to Article 6 are reported in this article.
Sources
Florida TaxWatch, “2025 How Florida Counties Compare” (December 2025)
City of Palm Bay FY2021-FY2026 Adopted Budget Books (via municipal records)
Palm Bay Charter Review Commission Meeting 2026-02 (February 12, 2026)
A Tale of Two Mandates: Palm Bay Council Proposes Exceeding Voter-Approved Tax Cap (The Palm Bayer, July 2025)
Palm Bay Tackles FY26 Budget: New Strategy Meets Big Needs (The Palm Bayer, May 2025)
Palm Bay’s New Tax Proposal: What Homeowners Need to Know (The Palm Bayer, July 2024)
